

Alpha rhythm#
This experiment constructs an interpretable cortical population rhythm and measures what changes when inhibition is weakened. The evidence combines time-domain traces, spectra, alpha-band power, and sensitivity to initial conditions.
Prompt#
Create a resting cortical circuit that produces an alpha-like brain rhythm, then weaken inhibition and show how the simulated EEG changes.
Agent decision path#
Classify the model as aggregate cortical-population dynamics.
Route the model to
brainmasswithbrainstatetransforms andbrainunitquantities.Select
JansenRitStepand its interpretableE - IEEG proxy.Define weaker inhibition as a reduction in inhibitory gain
Ai.Map two inhibition levels across three matched initial conditions.
Run the six complete trajectories through one
for_loopandvmapworkflow.Keep millivolt quantities through simulation and convert only at the spectral boundary.
Discard the transient, compute Welch spectra, and verify the script by full execution and compilation.
Result#
The baseline settles at an 11.0 Hz alpha rhythm with about 1.25 mV RMS. Reducing inhibitory gain from 22.0 to 17.6 mV suppresses the oscillation below the predefined 0.001 mV RMS reporting floor in all three initial conditions.
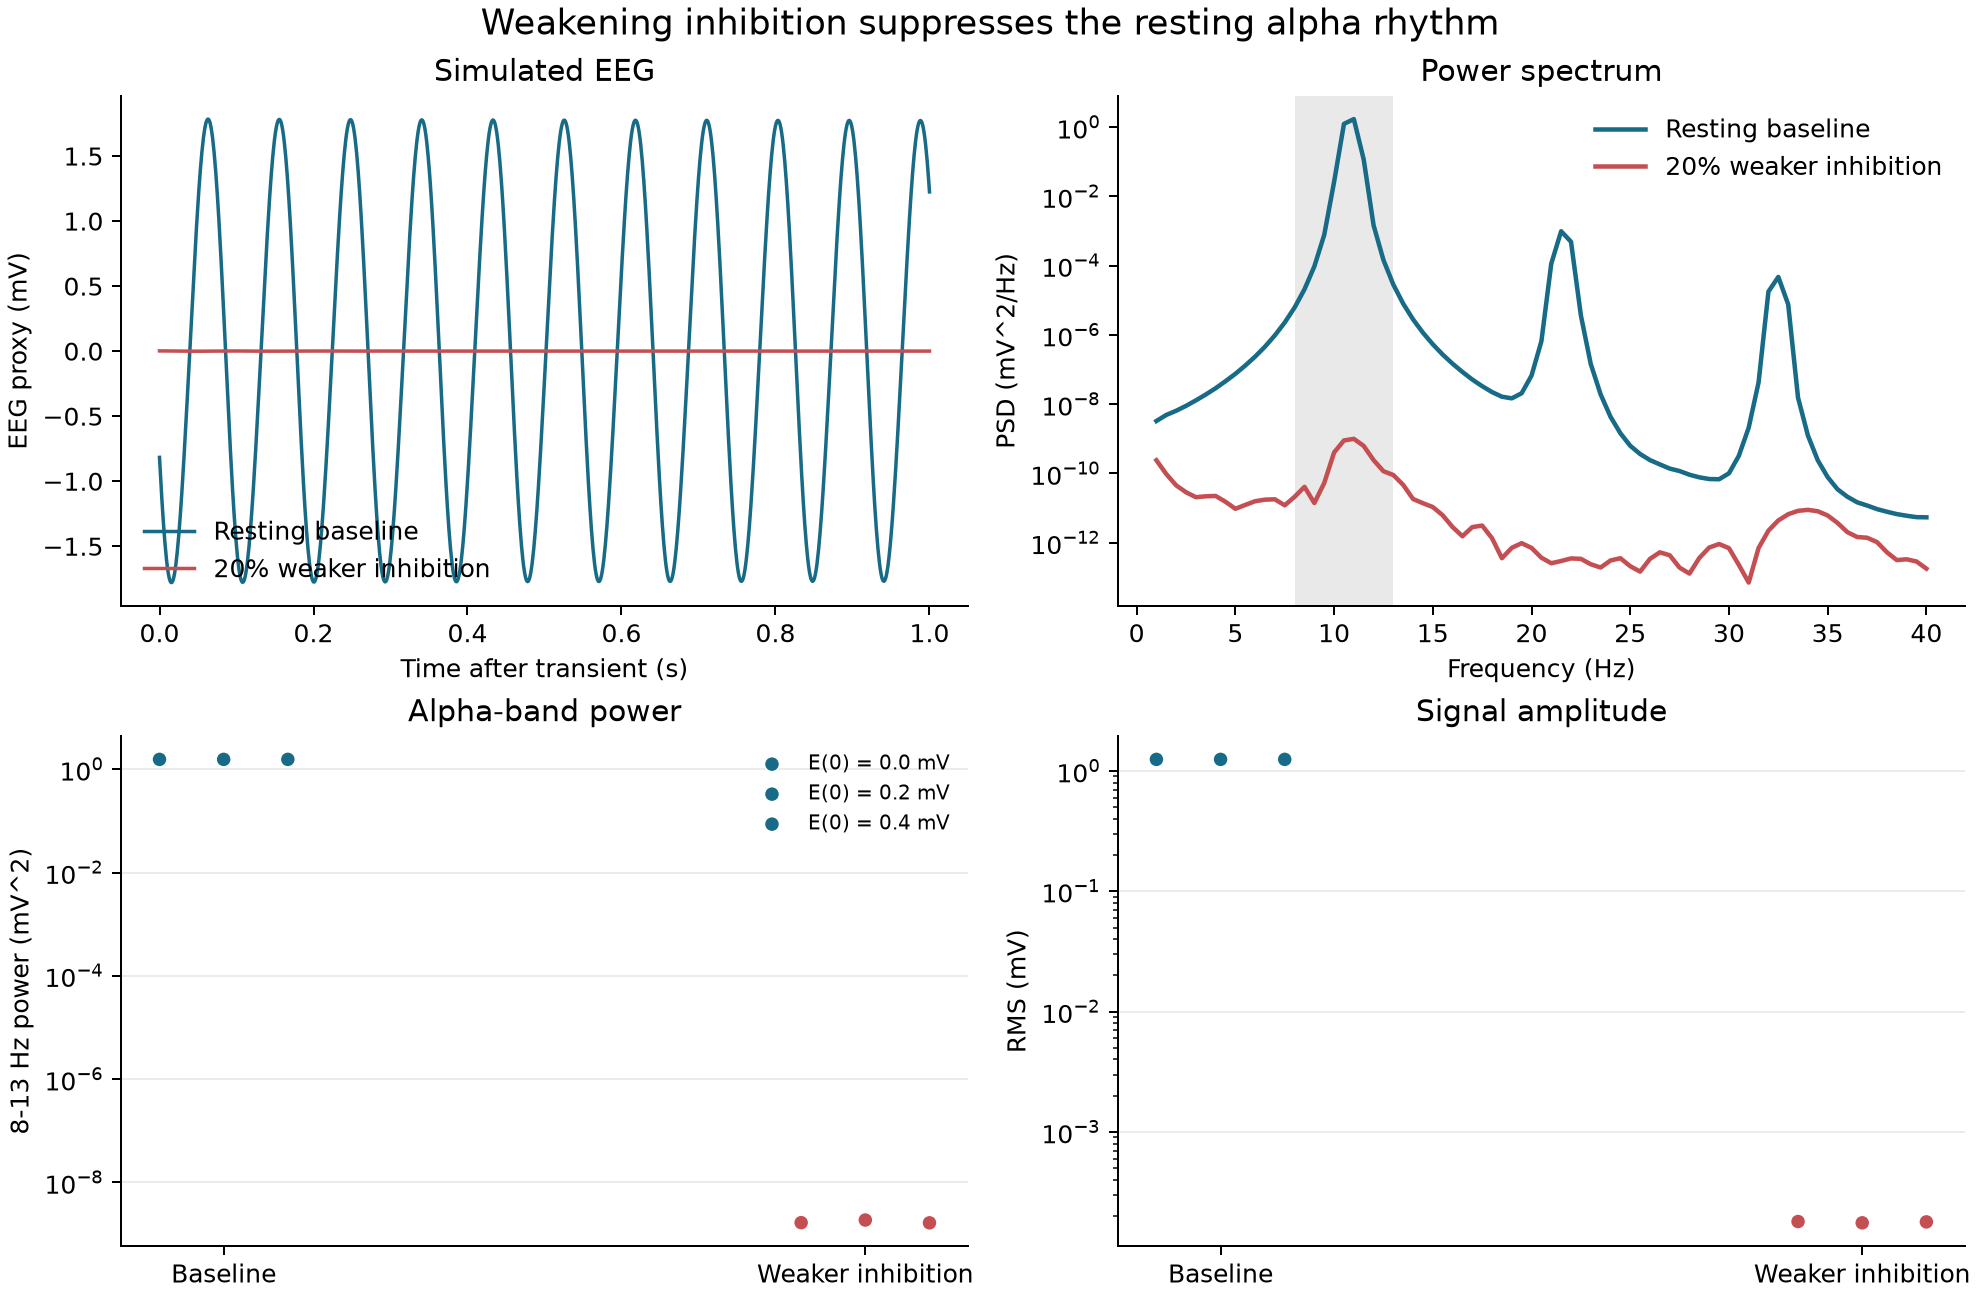
Fig. 2 The trace, spectrum, and sensitivity panels report the same condition contrast rather than relying on a selected waveform alone.#
With-BrainX skill/Without skill comparison#
With BrainX skill
Source captured · benchmark pending
Preserve the selected mass model, unit boundary, transient policy, and spectral analysis when collecting code and runtime measurements.
Without BrainX skill
Matched run not collected
Run the same prompt and success criteria before comparing implementation time, execution speed, or scientific validity.