Van der Pol Oscillator#
The Van der Pol oscillator is a classic self-sustained relaxation oscillator,
written here as the planar system \(\dot x = y,\; \dot y = \mu(1-x^2)y - x\). The single nonlinearity parameter \(\mu\) controls the character of the limit cycle: small \(\mu\) gives near-sinusoidal oscillations, while large \(\mu\) produces sharp relaxation oscillations with fast jumps and slow drifts. It is a textbook model of nonlinear oscillation and entrainment.
Reference: van der Pol (1926), On relaxation-oscillations, The London, Edinburgh and Dublin Philosophical Magazine 2(11):978-992.
Build the model#
node = brainmass.VanDerPolStep(in_size=1, mu=1.0)
node
VanDerPolStep(
  in_size=(1,),
  out_size=(1,),
  init_x=Uniform(low=0, high=0.05),
  init_y=Uniform(low=0, high=0.05),
  method=exp_euler,
  mu=Const(
    fit=False,
    t=IdentityT(),
    reg=None,
    val=Array(1., dtype=float32)
  )
)
Run a simulation#
sim = brainmass.Simulator(node, dt=0.1 * u.ms)
res = sim.run(300. * u.ms, monitors=['x', 'y'], transient=50. * u.ms)
res['x'].shape
(2500, 1)
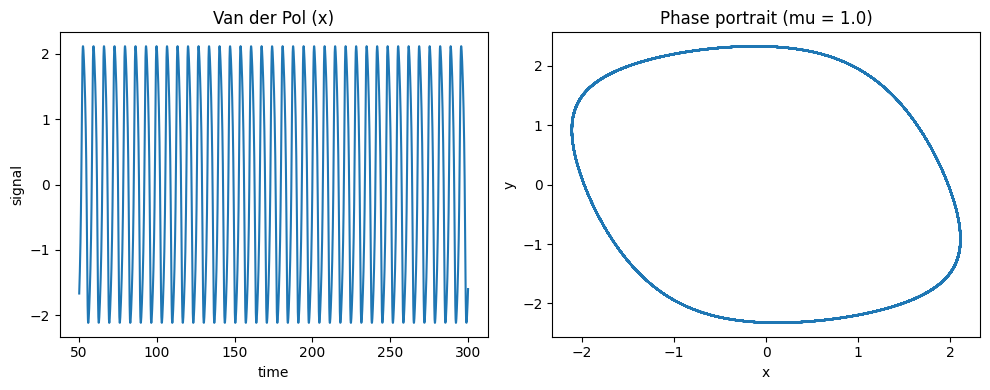
Visualize#
The phase portrait shows the characteristic Van der Pol limit cycle; the timeseries shows the oscillation in x.
fig, axes = plt.subplots(1, 2, figsize=(10, 4))
brainmass.viz.plot_timeseries(res['x'], ts=res['ts'], ax=axes[0])
axes[0].set_title('Van der Pol (x)')
brainmass.viz.plot_phase_portrait(res['x'], res['y'], ax=axes[1])
axes[1].set_title('Phase portrait (mu = 1.0)')
plt.tight_layout()
plt.show()
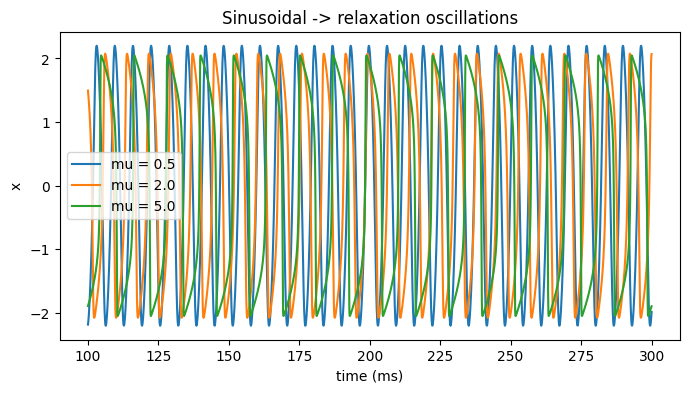
Try it: vary the nonlinearity mu#
Increase mu to morph from near-harmonic oscillations toward stiff relaxation oscillations with sharp transitions.
fig, ax = plt.subplots(figsize=(8, 4))
for mu in [0.5, 2.0, 5.0]:
    m = brainmass.VanDerPolStep(in_size=1, mu=mu)
    r = brainmass.Simulator(m, dt=0.1 * u.ms).run(
        300. * u.ms, monitors=['x'], transient=100. * u.ms)
    ax.plot(u.get_magnitude(r['ts']), u.get_magnitude(r['x'])[:, 0], label=f'mu = {mu}')
ax.set_xlabel('time (ms)'); ax.set_ylabel('x'); ax.legend()
ax.set_title('Sinusoidal -> relaxation oscillations')
plt.show()